Reports
ROAS by ad campaign: spend, revenue and profit for every campaign as the network names it.
Reports put what your ads cost next to what their leads sold for, so you can see which ads make money. Spend comes from the ad network through cost tracking. Revenue comes from your own waterfall: the price a destination paid for each lead.
You'll find them under Measure → Reports. The page is called ROAS, short for return on ad spend, and it opens on By ad platform campaign: one row per campaign exactly as Meta, TikTok, Snapchat or Google names it.
Spend arrives from the network already labelled with the network's campaign id, so this is the view that works the moment cost tracking runs. You do not need a EventsIQ campaign set up for it. Every lead that carries the same network campaign id is joined to that campaign's spend.
ROAS by ad platform campaign
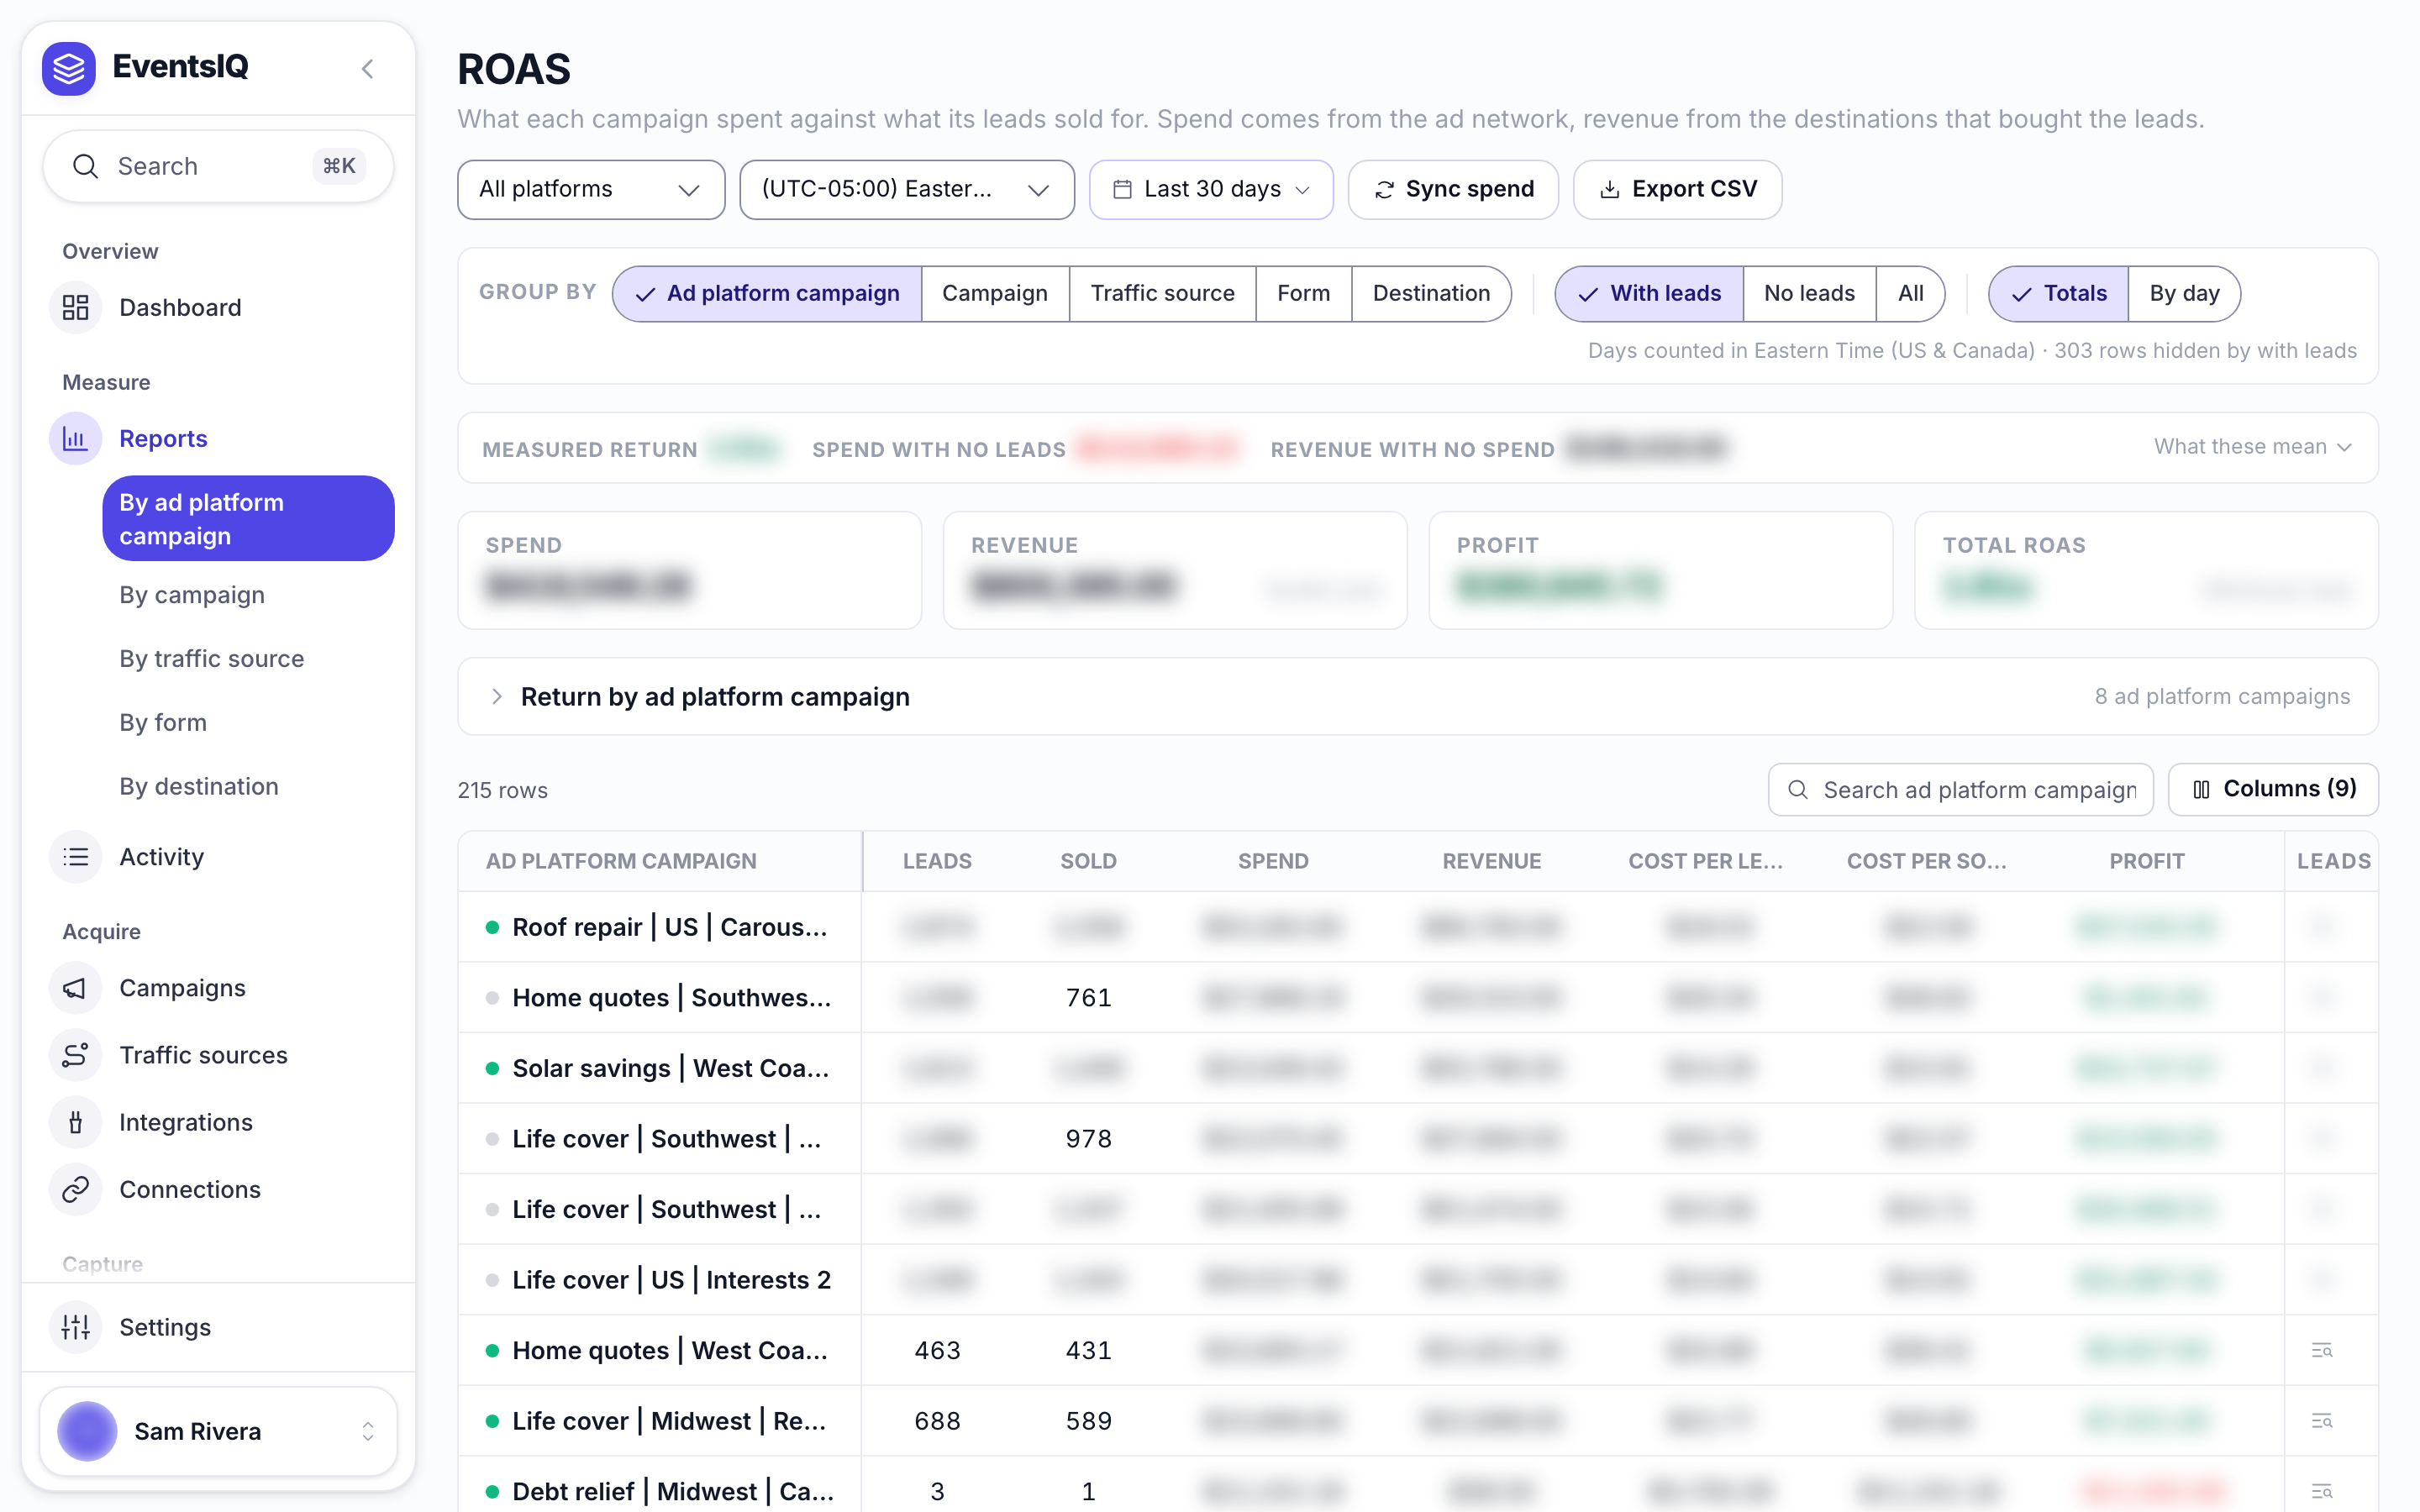
Each row is one ad campaign, and the columns answer the questions you would otherwise work out in a spreadsheet:
| Column | What it tells you |
|---|---|
| Ad campaign | The campaign's name in the ad network |
| Leads | Leads that arrived carrying this campaign's id |
| Sold | How many of those a destination bought |
| Spend | What the network charged for the campaign in the range |
| Revenue | What destinations paid for its leads |
| Cost per lead | Spend divided by leads |
| Cost per sold | Spend divided by sold leads |
| Profit | Revenue minus spend |
| ROAS | Revenue divided by spend. 2.00x means $2 back for every $1 |
The table is sorted by spend, so the campaigns costing you the most are at the top. Click a column heading to sort by it, or type in Search ad campaign... to find one.
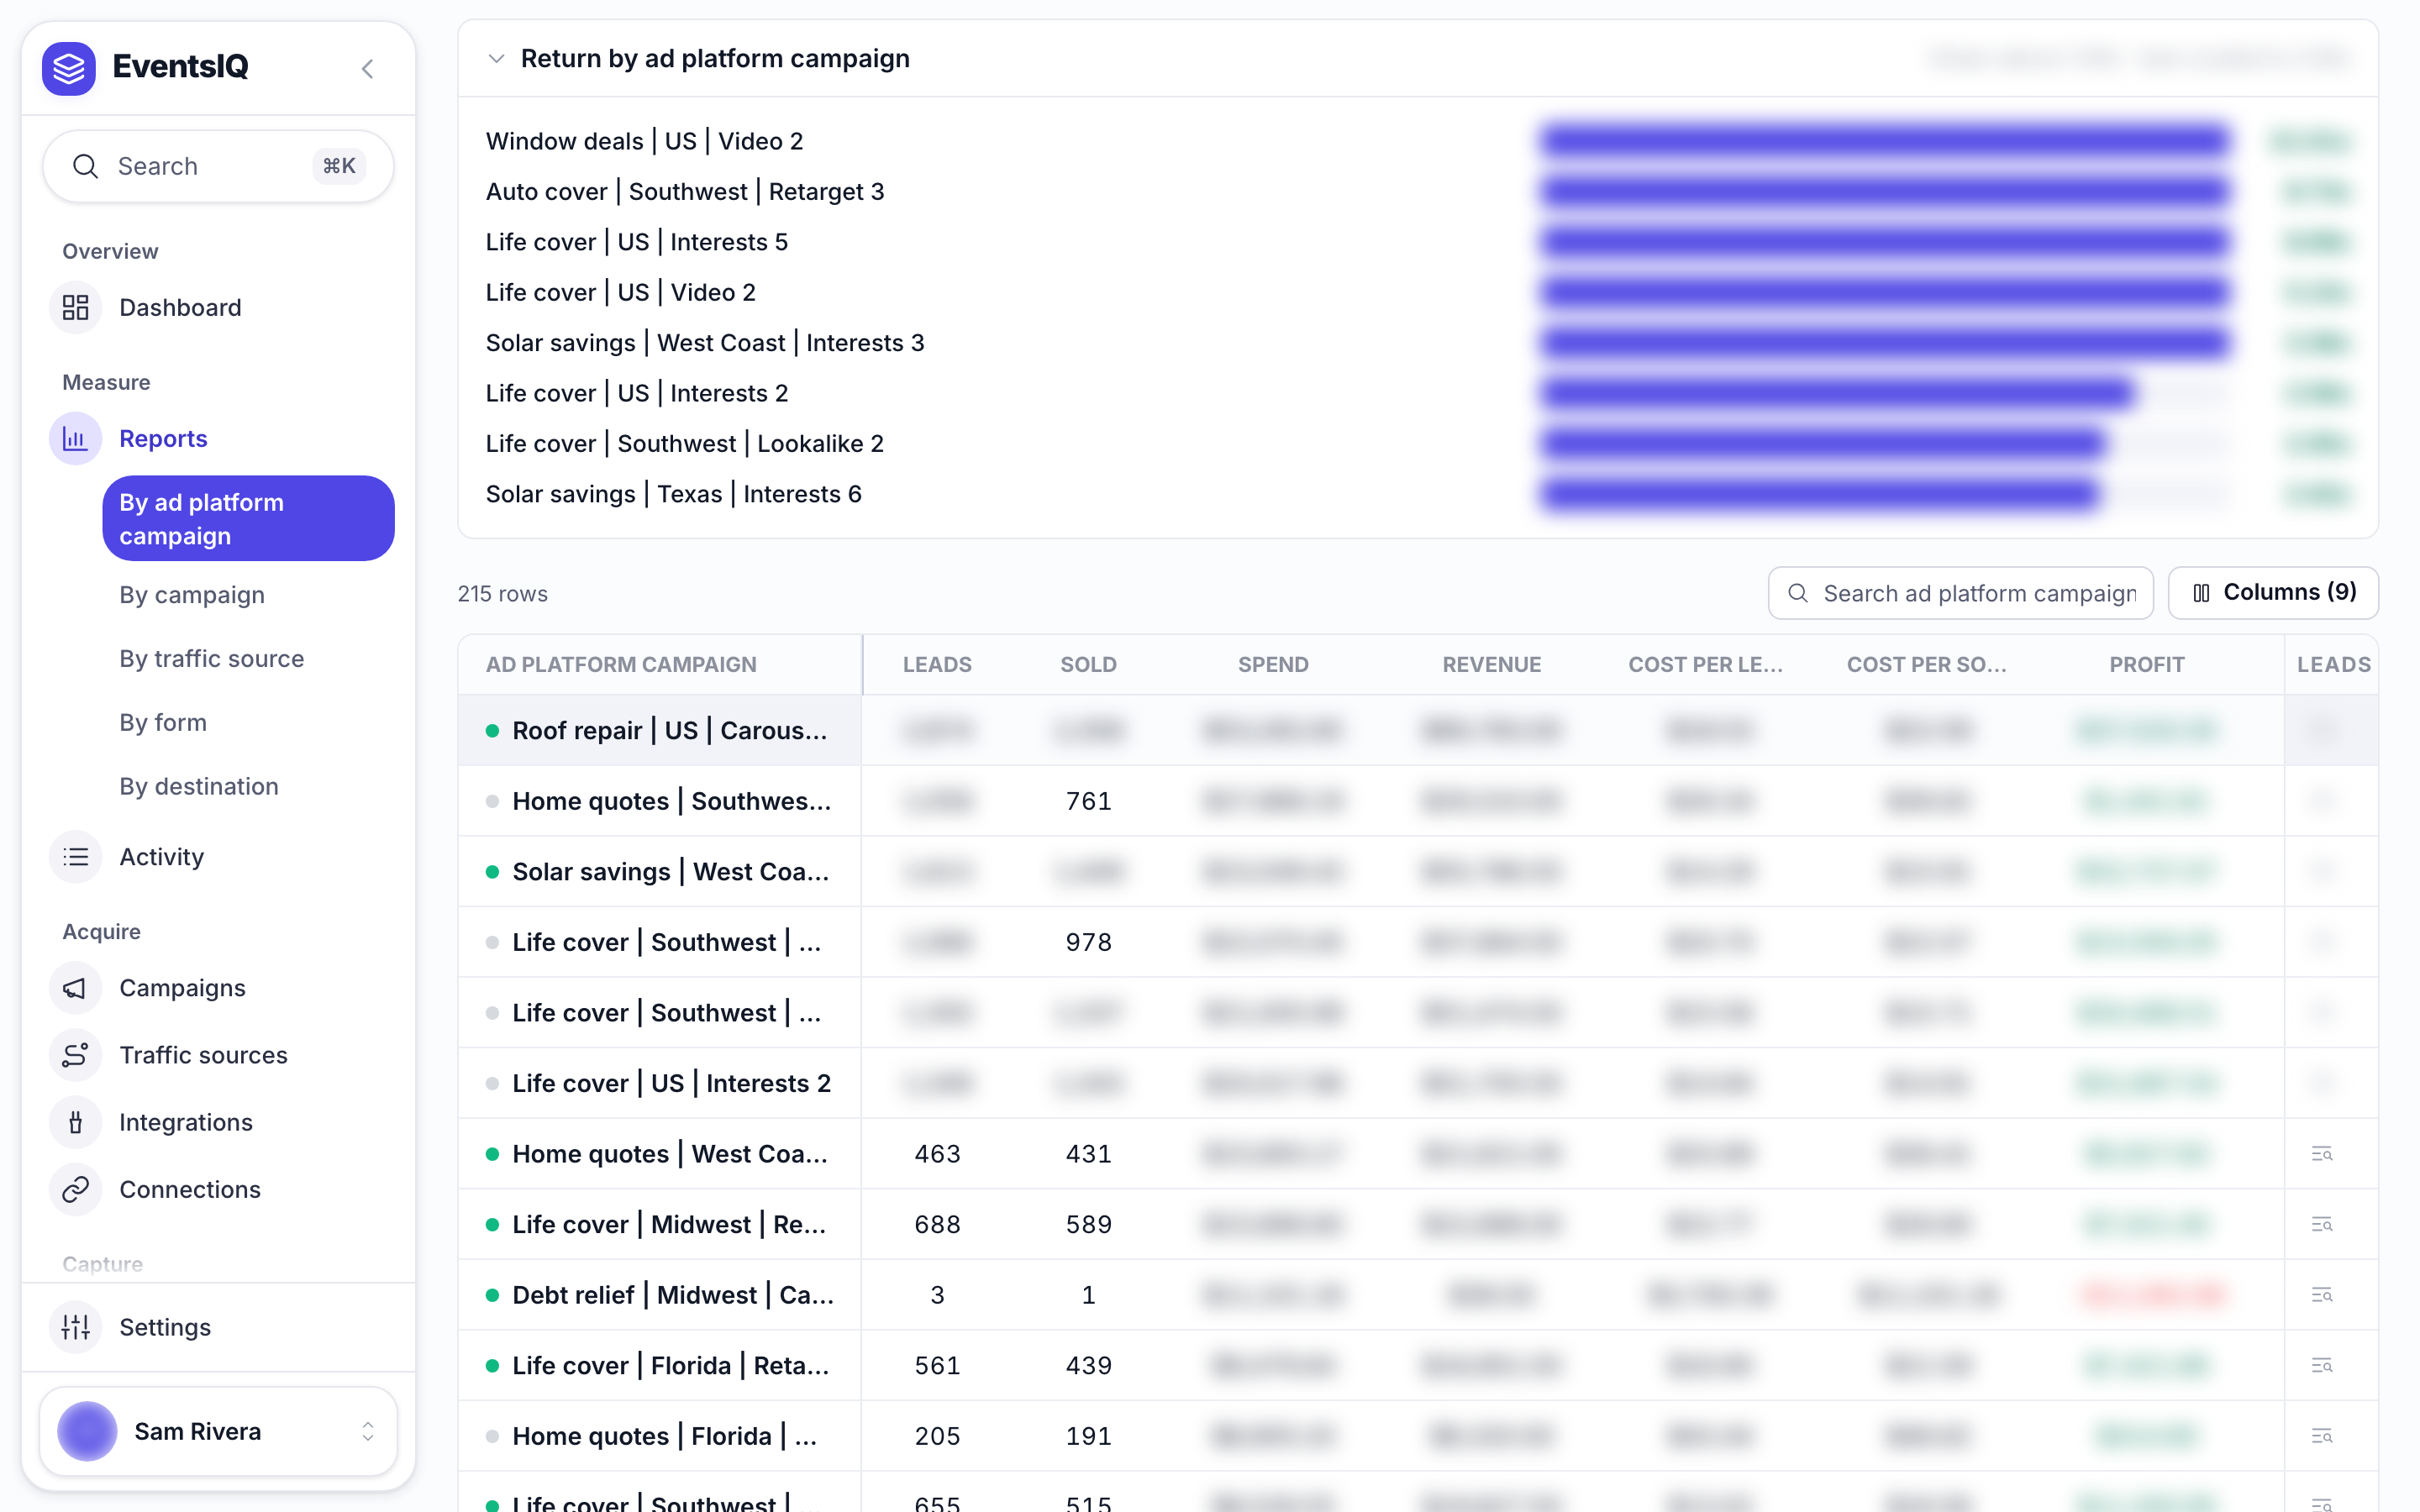
Return by ad platform campaign
Open Return by ad platform campaign above the table for a bar per campaign. Bars are green above
1.00x, where a campaign pays for itself, and scaled to 2.00x, so you can see at a glance which
campaigns to scale and which to cut.
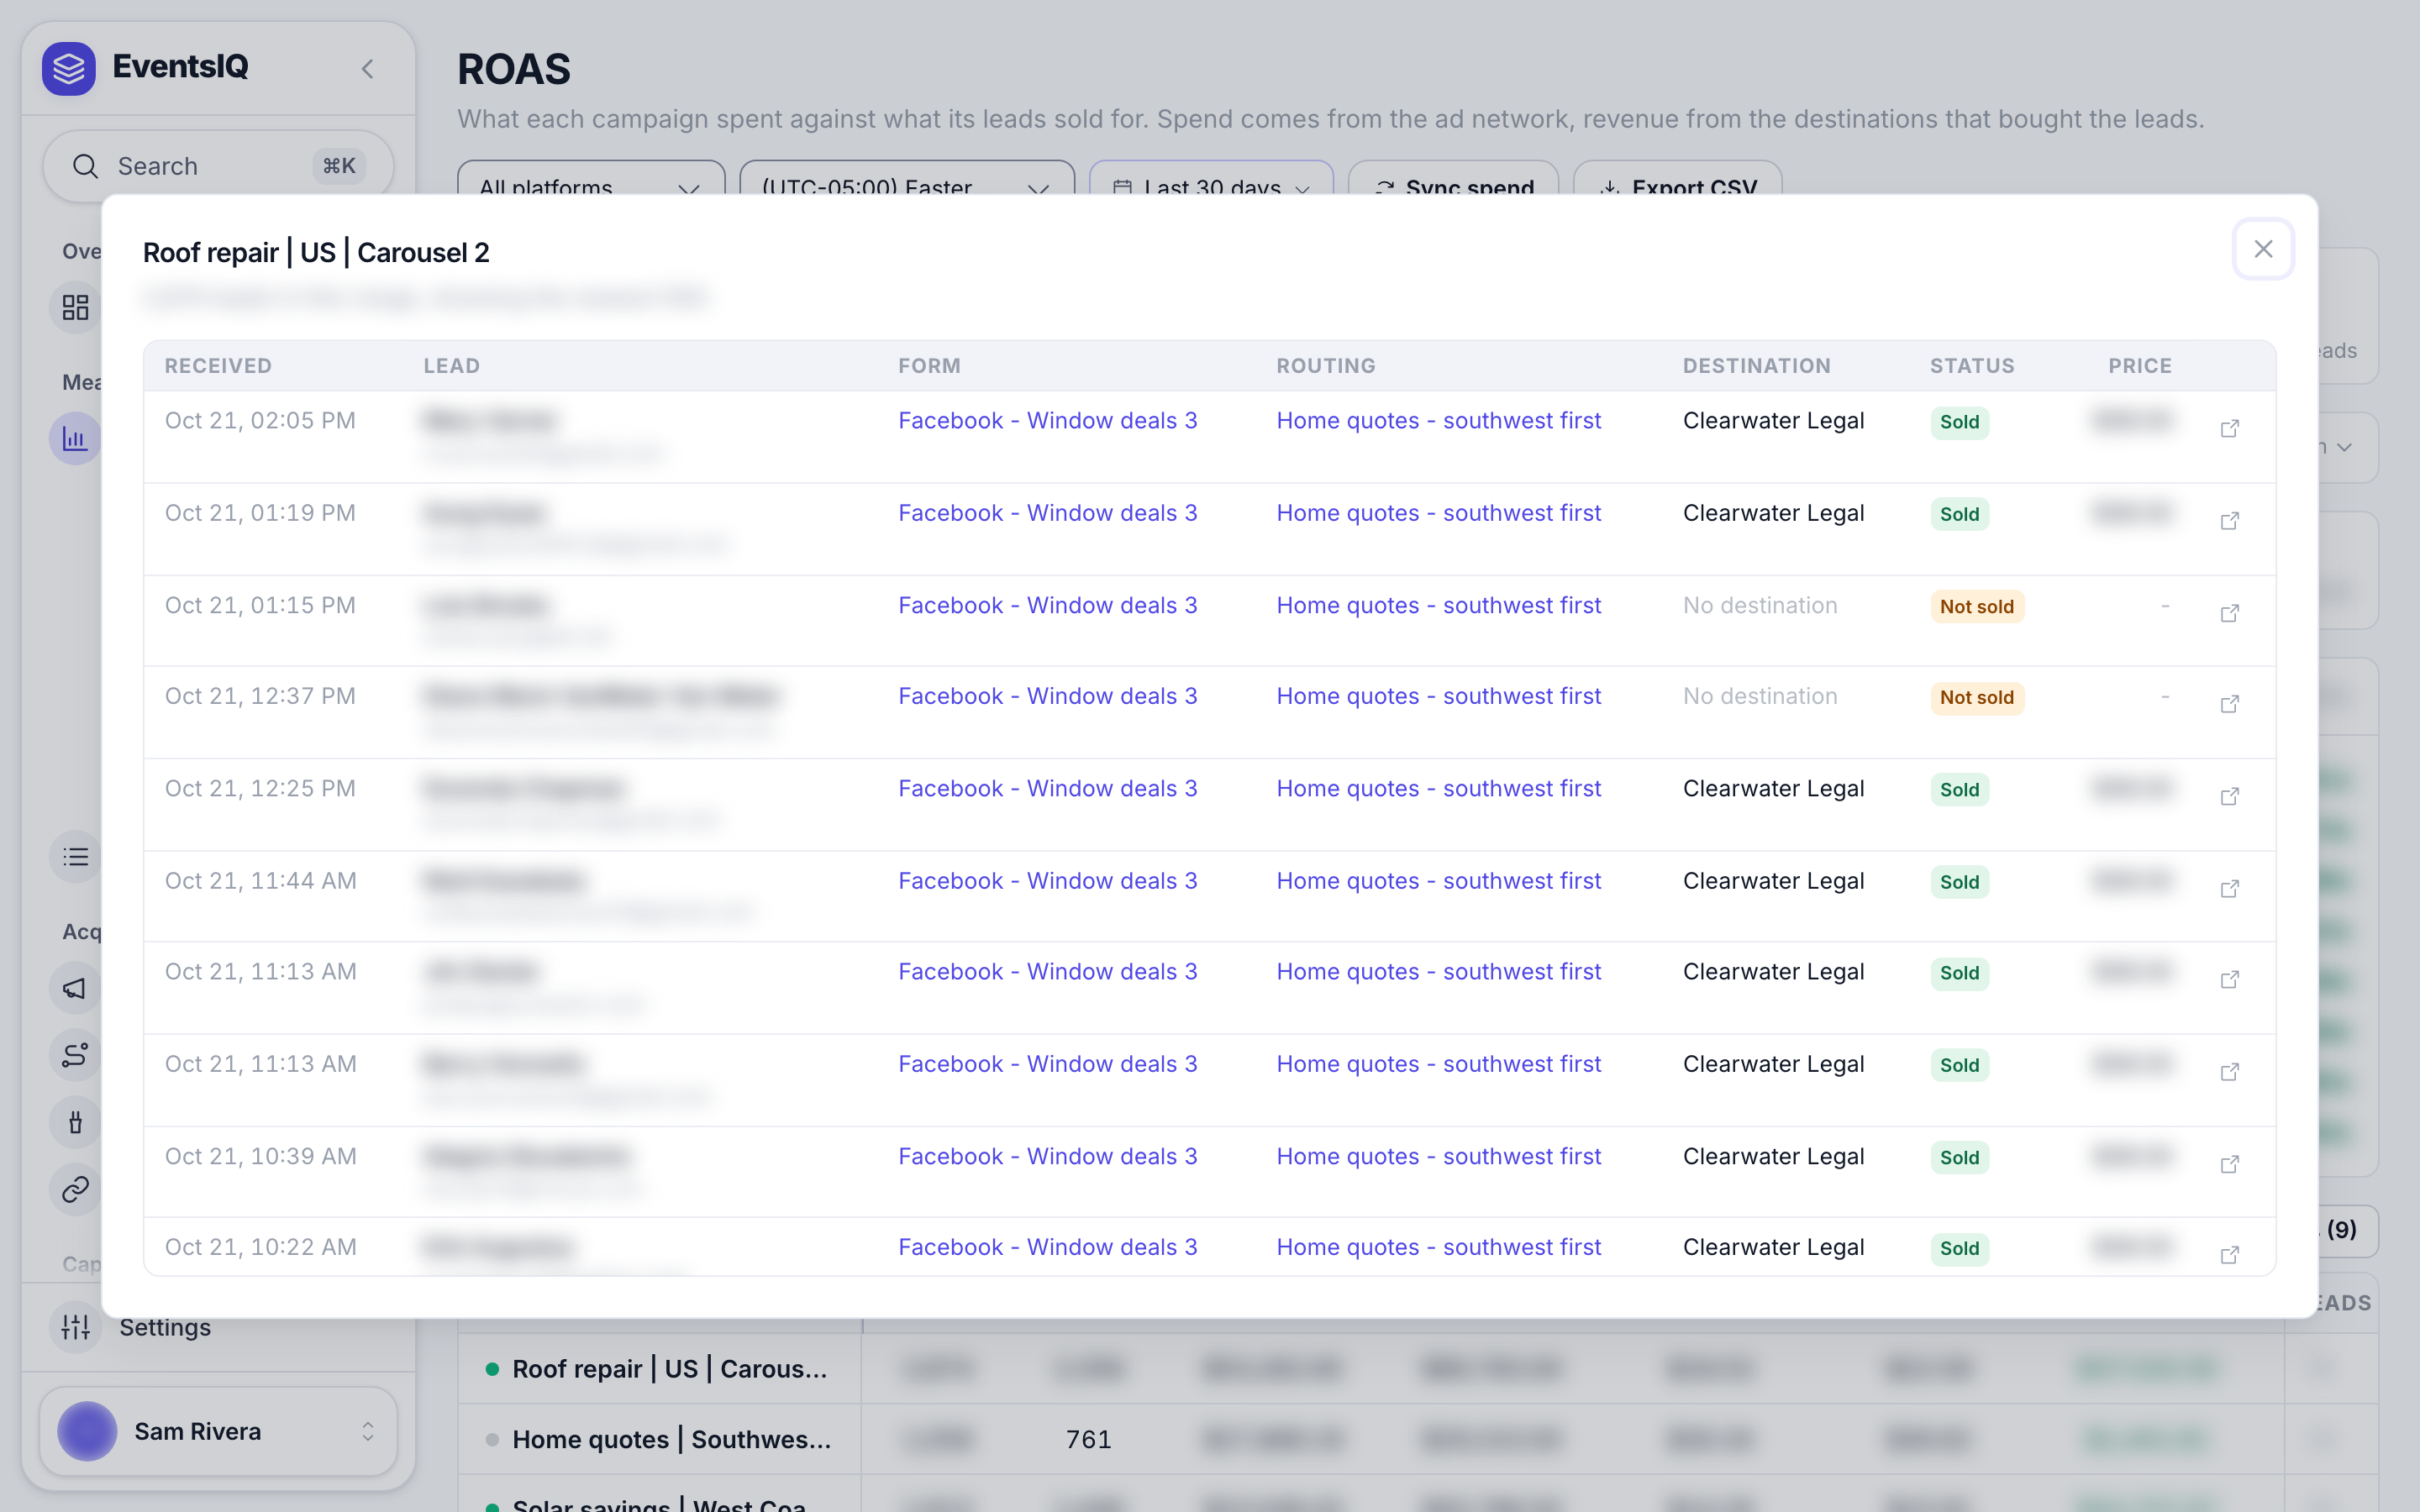
The leads behind a row
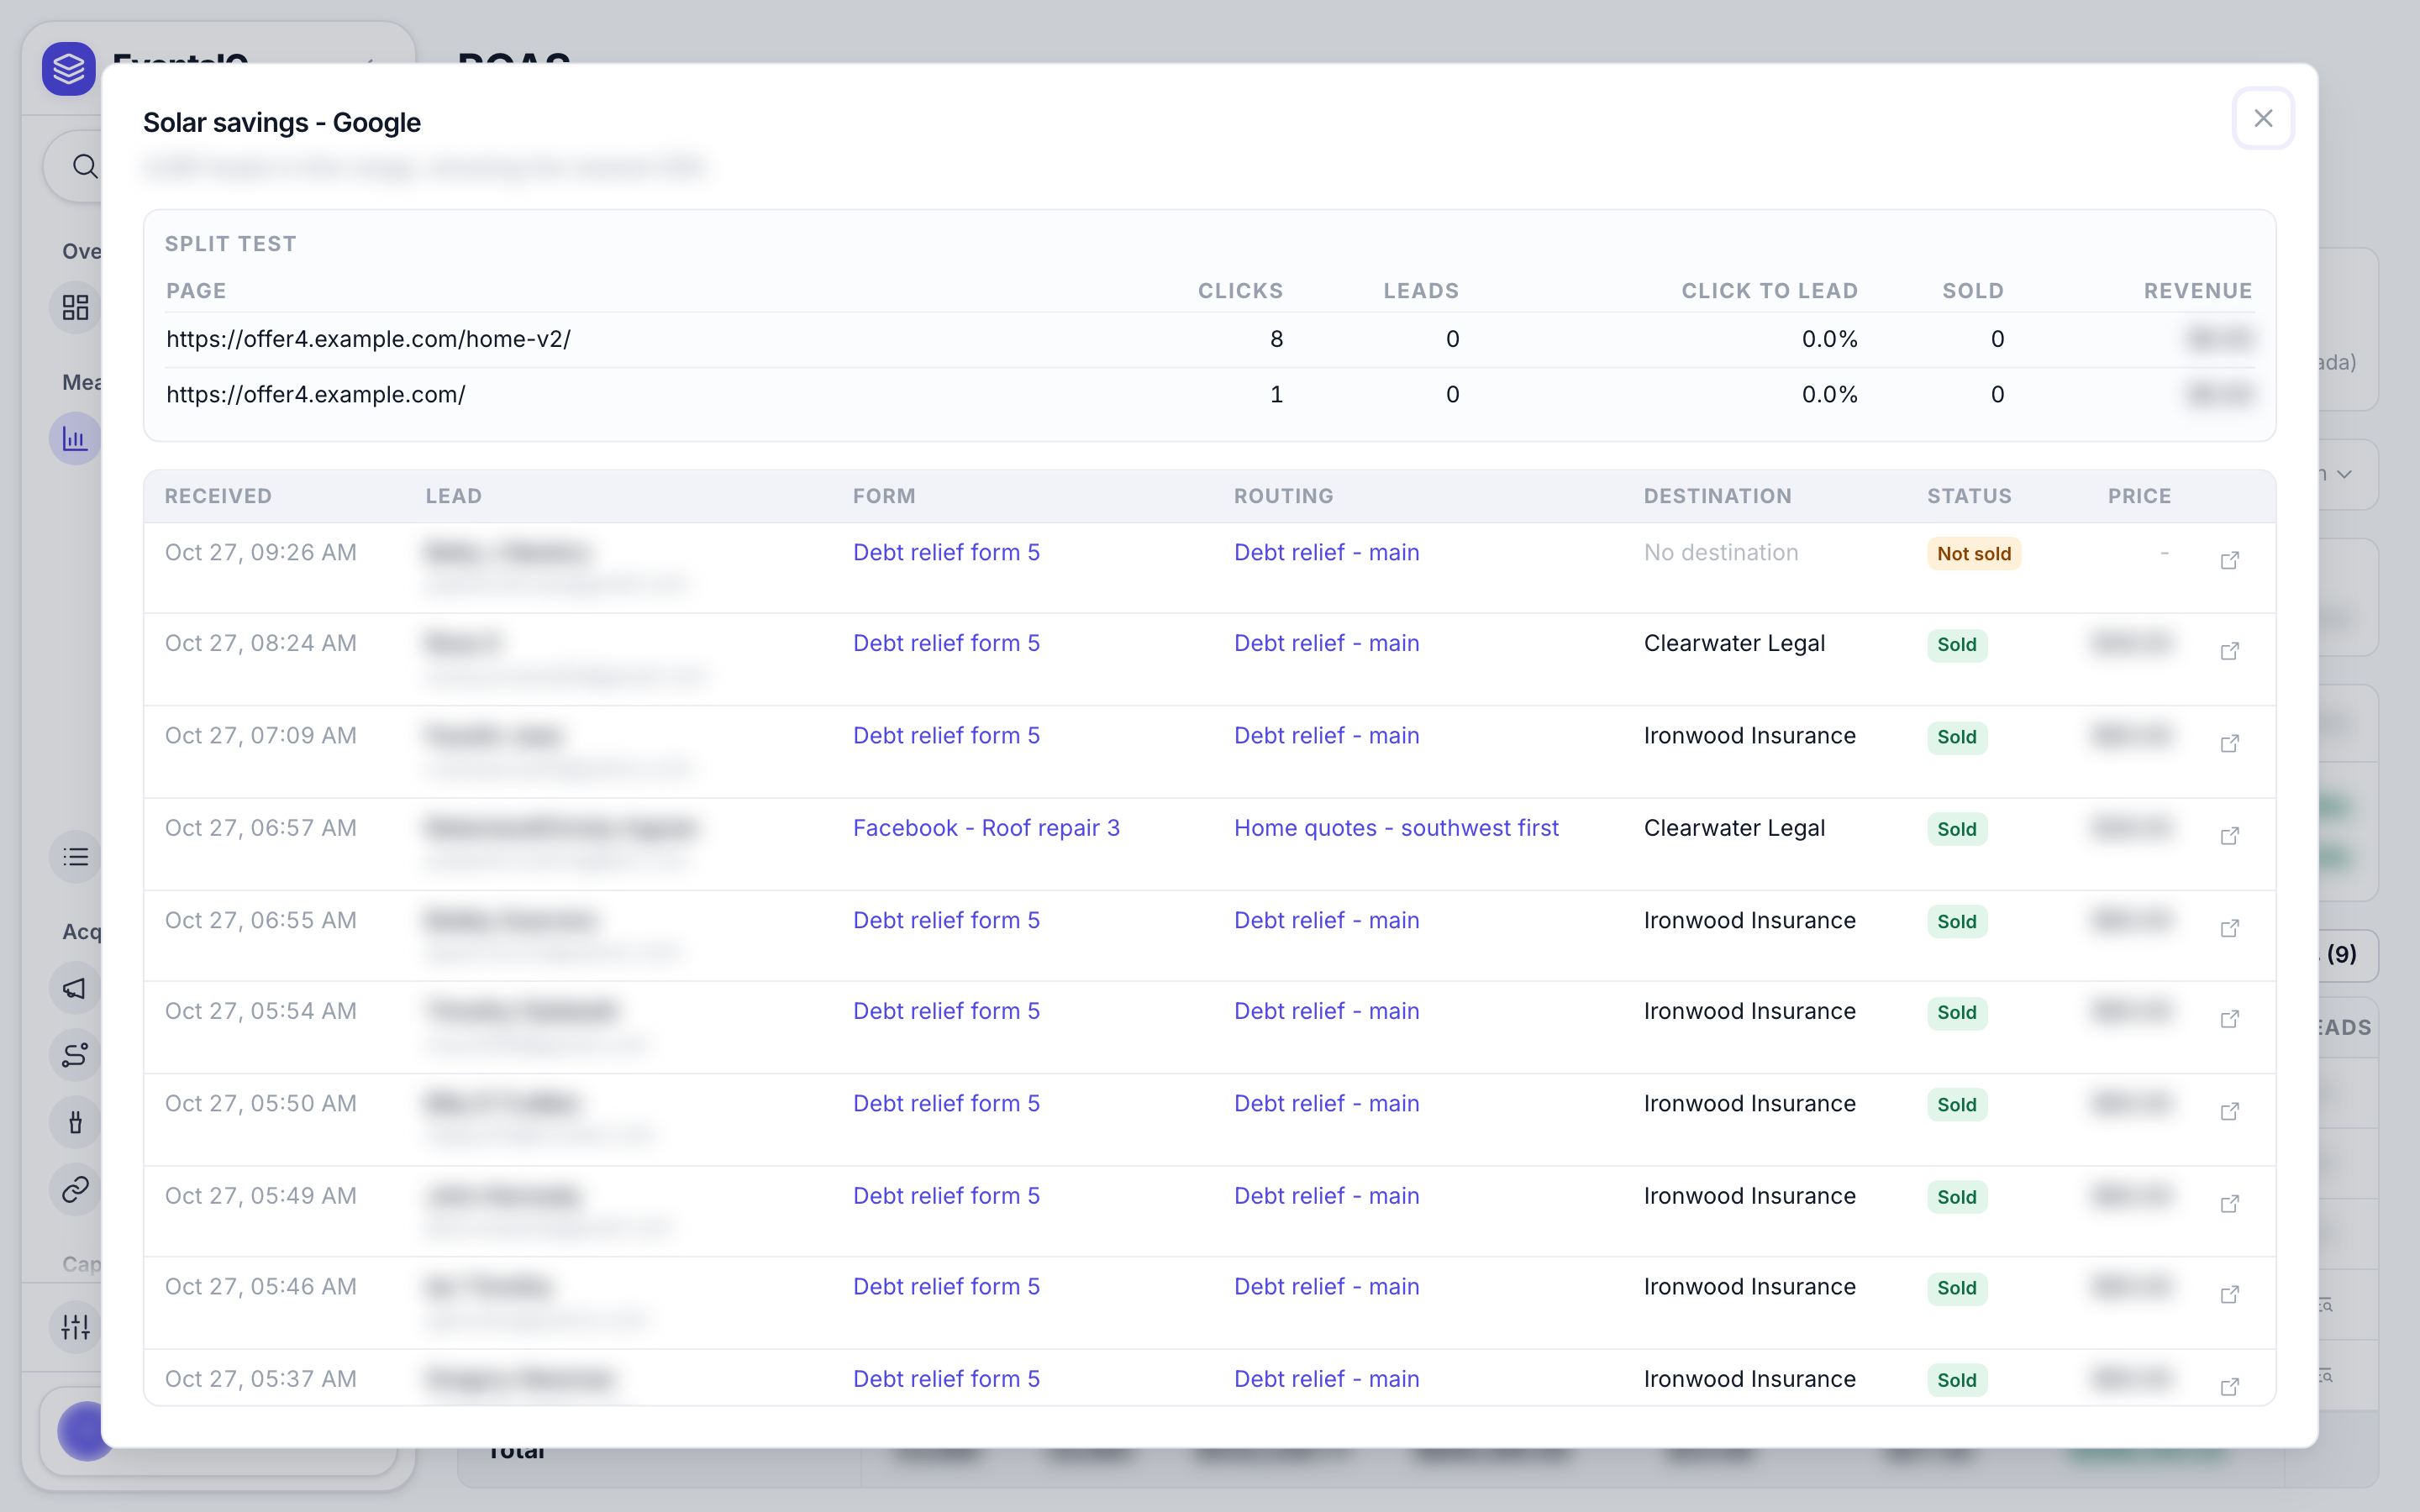
Click the list icon at the end of a row to see every lead that campaign produced: when it arrived, the form, the routing, who bought it, the status and the price. Each lead links to its full log.
No ad campaign id on the lead
This row collects leads that arrived without a network campaign id, so there is no spend to join them to. It usually means:
- the ad does not use the traffic source's parameters, or the campaign_id row was removed;
- an instant form campaign has no Ad campaign picked on its General tab;
- the leads came from somewhere that is not paid traffic at all.
The controls
| Control | What it does |
|---|---|
| All platforms | Show one network only: Facebook and Instagram, Google, TikTok, Snapchat, Microsoft, Everything else |
| Time zone | Which time zone a "day" is counted in. Spend and leads both use it |
| Date range | The days to report on |
| Sync spend | Run cost tracking now instead of waiting for the next scheduled read |
| Export CSV | Download the table as it is shown |
Under Group by:
- With leads / No leads / All chooses whether to show campaigns that spent without producing a lead. With leads is the default, and the line underneath says how many rows it hid. Switch to No leads to find money going out with nothing coming back.
- Totals shows one row per campaign for the whole range. By day splits each campaign into days, which is how you spot the day a campaign stopped working.
The summary cards
| Card | What it is |
|---|---|
| Spend | What the ad networks charged |
| Revenue | What destinations paid for the leads, and how many sold |
| Profit | Revenue minus spend |
| Total ROAS | Revenue divided by spend, and revenue per lead underneath |
The coverage strip
Above the cards, three numbers tell you how much of that is trustworthy. Click What these mean for the detail.
| Number | What it means |
|---|---|
| Measured return | ROAS counting only campaigns that have both spend and leads. The figure to judge campaigns by |
| Spend with no leads | Money spent on campaigns that produced nothing here. Red when it is above zero |
| Revenue with no spend | Leads sold from rows with no cost recorded, for example the No ad campaign id row, organic traffic or an ad account cost tracking does not read |
A large Revenue with no spend usually means cost tracking is missing an ad account, or leads are losing their campaign id. A large Spend with no leads means ads are running that EventsIQ is not seeing leads from.
More columns
Click Columns to add, remove or reorder columns. Tick to show, drag to reorder, and Reset to go back to the default.
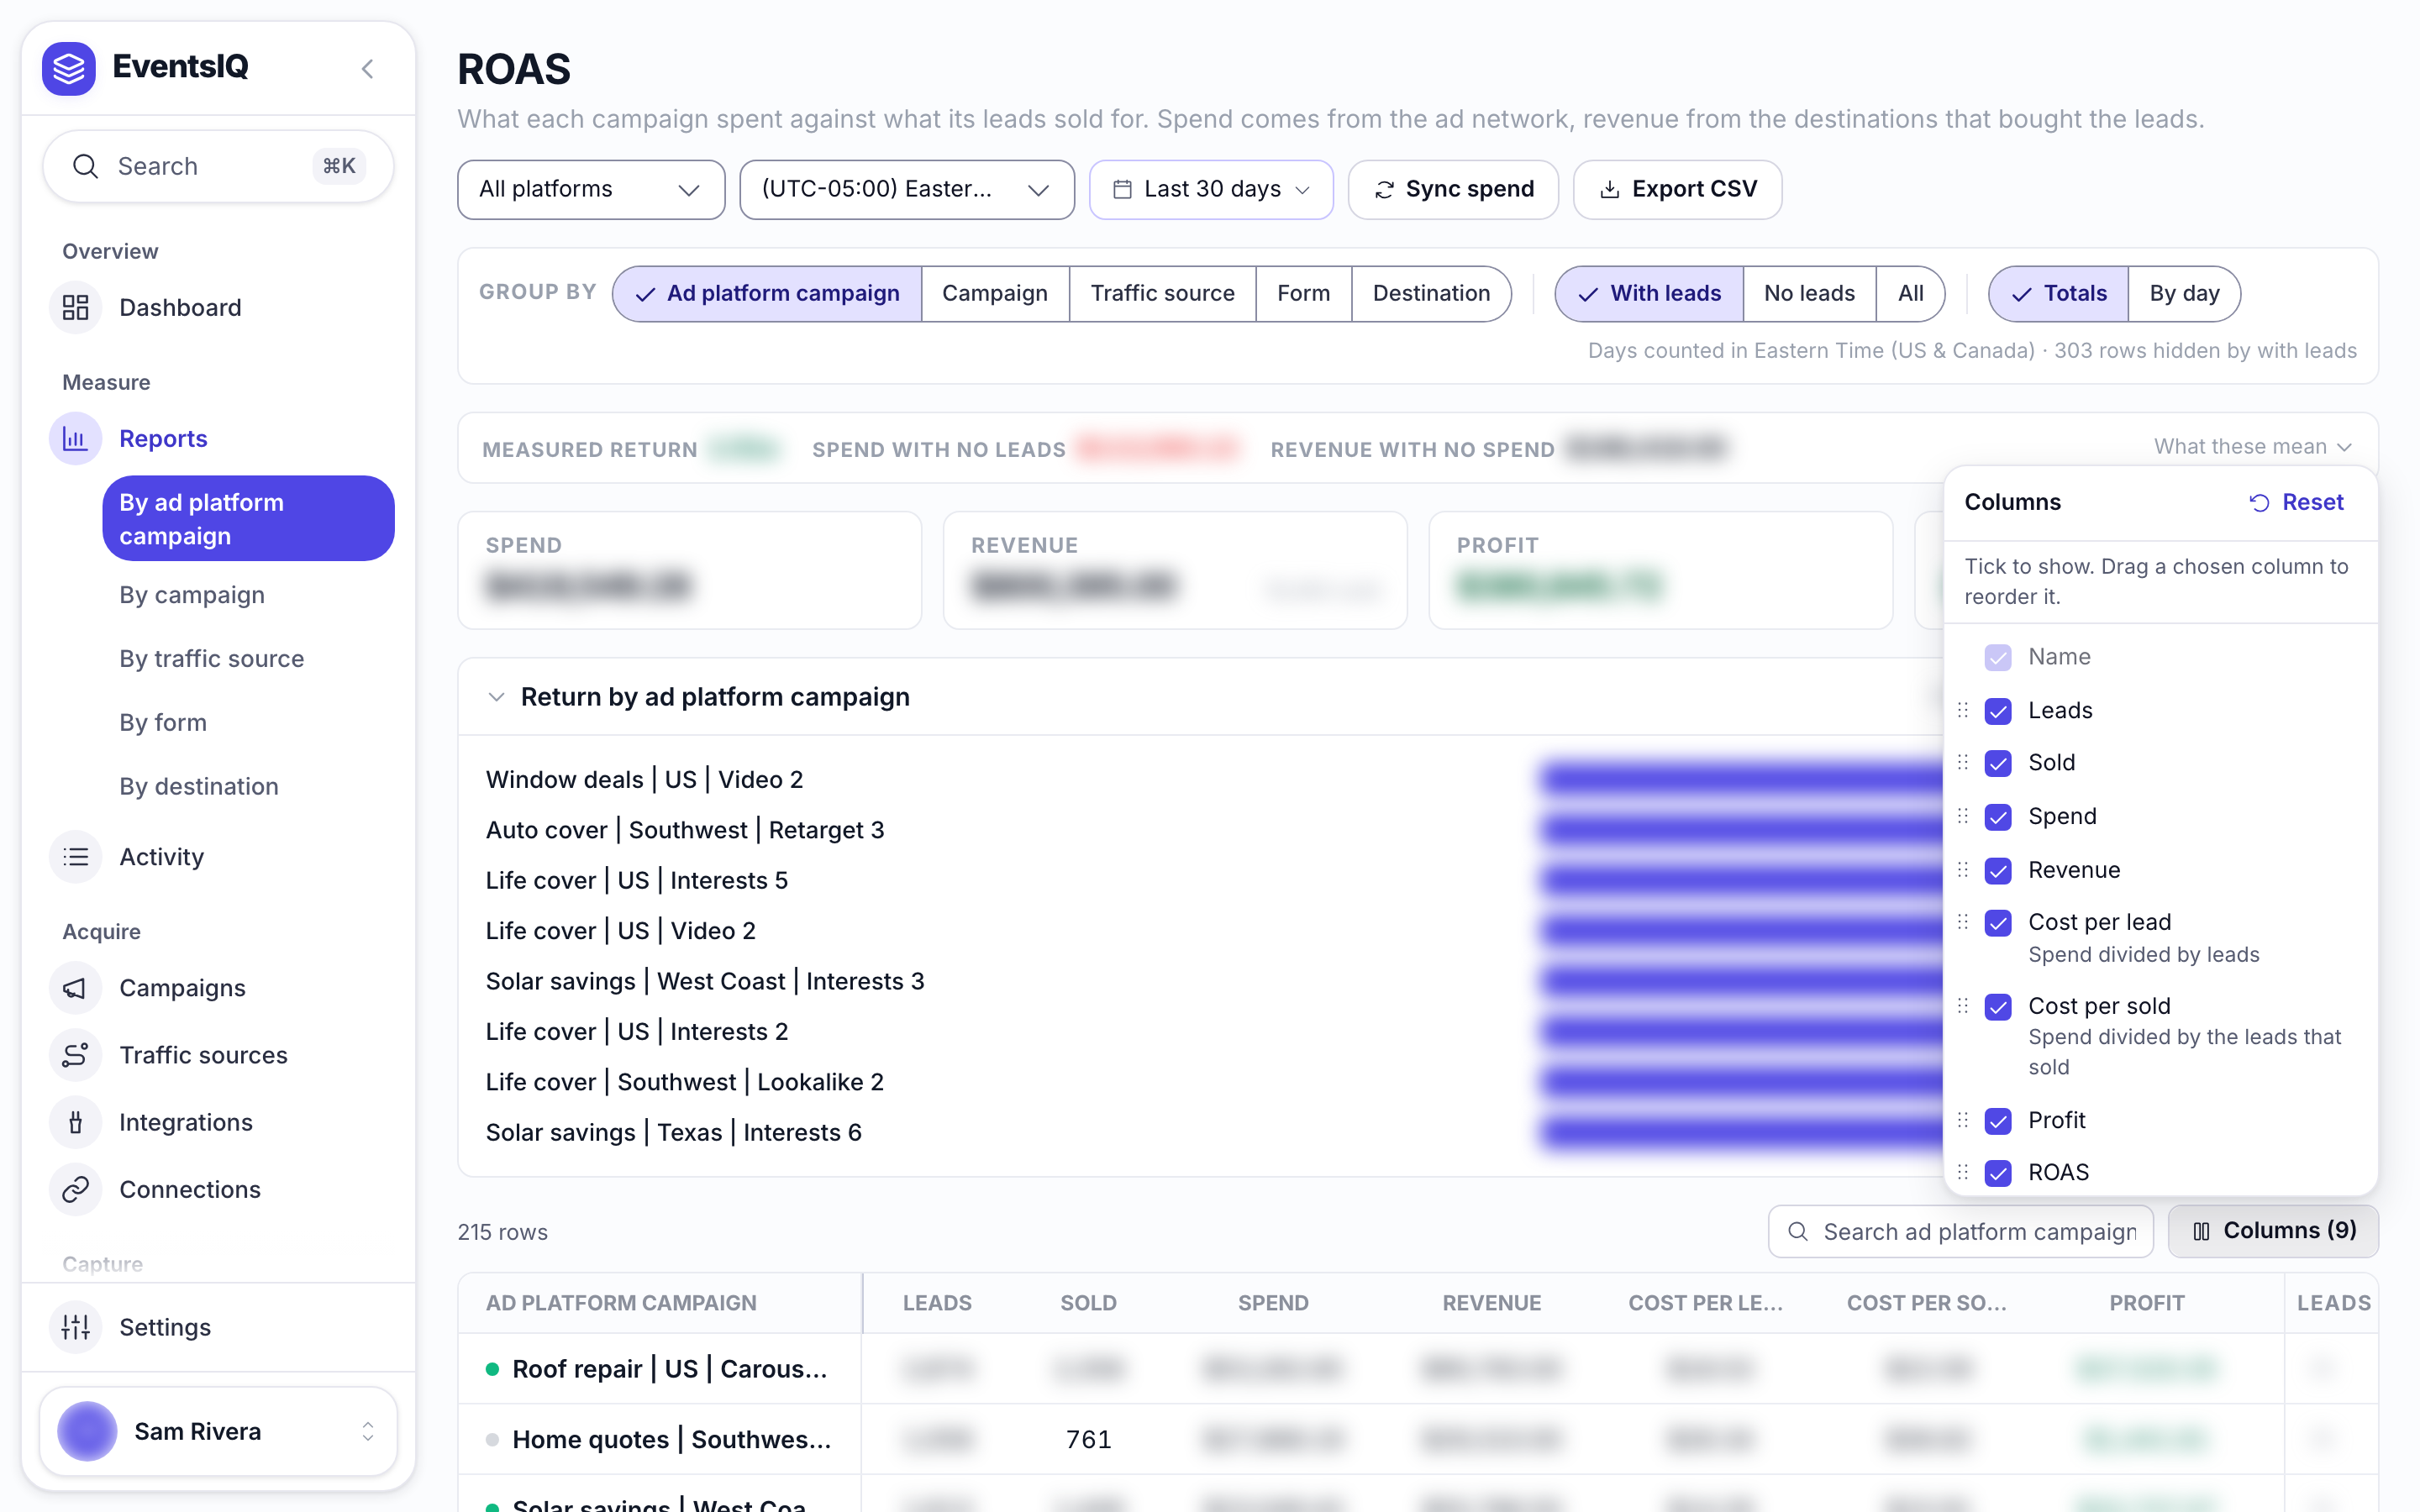
| Column | What it is |
|---|---|
| Ad account | The network account this campaign is billed under |
| Sold % | Share of leads that sold |
| Revenue per lead | The number to compare against cost per lead |
| Impressions, Link clicks, All clicks | As the ad network reports them. All clicks includes reactions, comments and shares |
| Tracked clicks, Cost per click, Click to lead % | Clicks on your own tracking links. Only when grouping by Campaign, because the network never sees these clicks |
Other groupings
Group by can also show the same numbers another way:
| Group by | Each row is | Spend shown |
|---|---|---|
| Ad platform campaign | One campaign as the ad network names it. The default | Yes |
| Campaign | One of your EventsIQ campaigns, adding up the ad campaigns it claims | Yes |
| Traffic source | One traffic source | Yes |
| Form | One form or source | No |
| Destination | One destination that bought leads | No |
Form and Destination show leads and revenue only, because spend belongs to ad campaigns, not to forms or destinations.
By campaign
Grouping by Campaign adds a few things that only make sense for your own campaigns:
- Any status / Running / Not running filters by whether the ad campaign is live.
- The Tracked clicks, Cost per click and Click to lead % columns.
- A Split test table inside each row, when the campaign splits traffic across landing pages.
- A Not in one of your campaigns row, for spend and leads from ad campaigns no EventsIQ campaign has claimed yet.
A EventsIQ campaign claims an ad campaign in one of two ways: its leads arrive carrying that ad campaign's id, or the ad campaign is picked as its Ad campaign. An ad campaign claimed by two EventsIQ campaigns stays under Not in one of your campaigns rather than being counted twice.
How the numbers are joined
Spend is stored per ad campaign, per hour. A lead carries its ad campaign id. Reports join the two on that id and on the day, counted in the time zone you pick. So a lead submitted at 11pm in New York and the spend in that same hour land on the same day, even though it is already tomorrow in UTC.
If spend appears but revenue and ROAS stay at zero, check:
- Your traffic source still has its campaign_id row, and your ads use the campaign's tracking URL.
- For instant forms, the campaign's Ad campaign is picked.
- Leads are actually being sold. Revenue is what destinations paid, so unsold leads add nothing.
Related
- Integrations: setting up cost tracking.
- Logs: the full story of any lead in a report.
- Set up paid traffic: the whole setup.